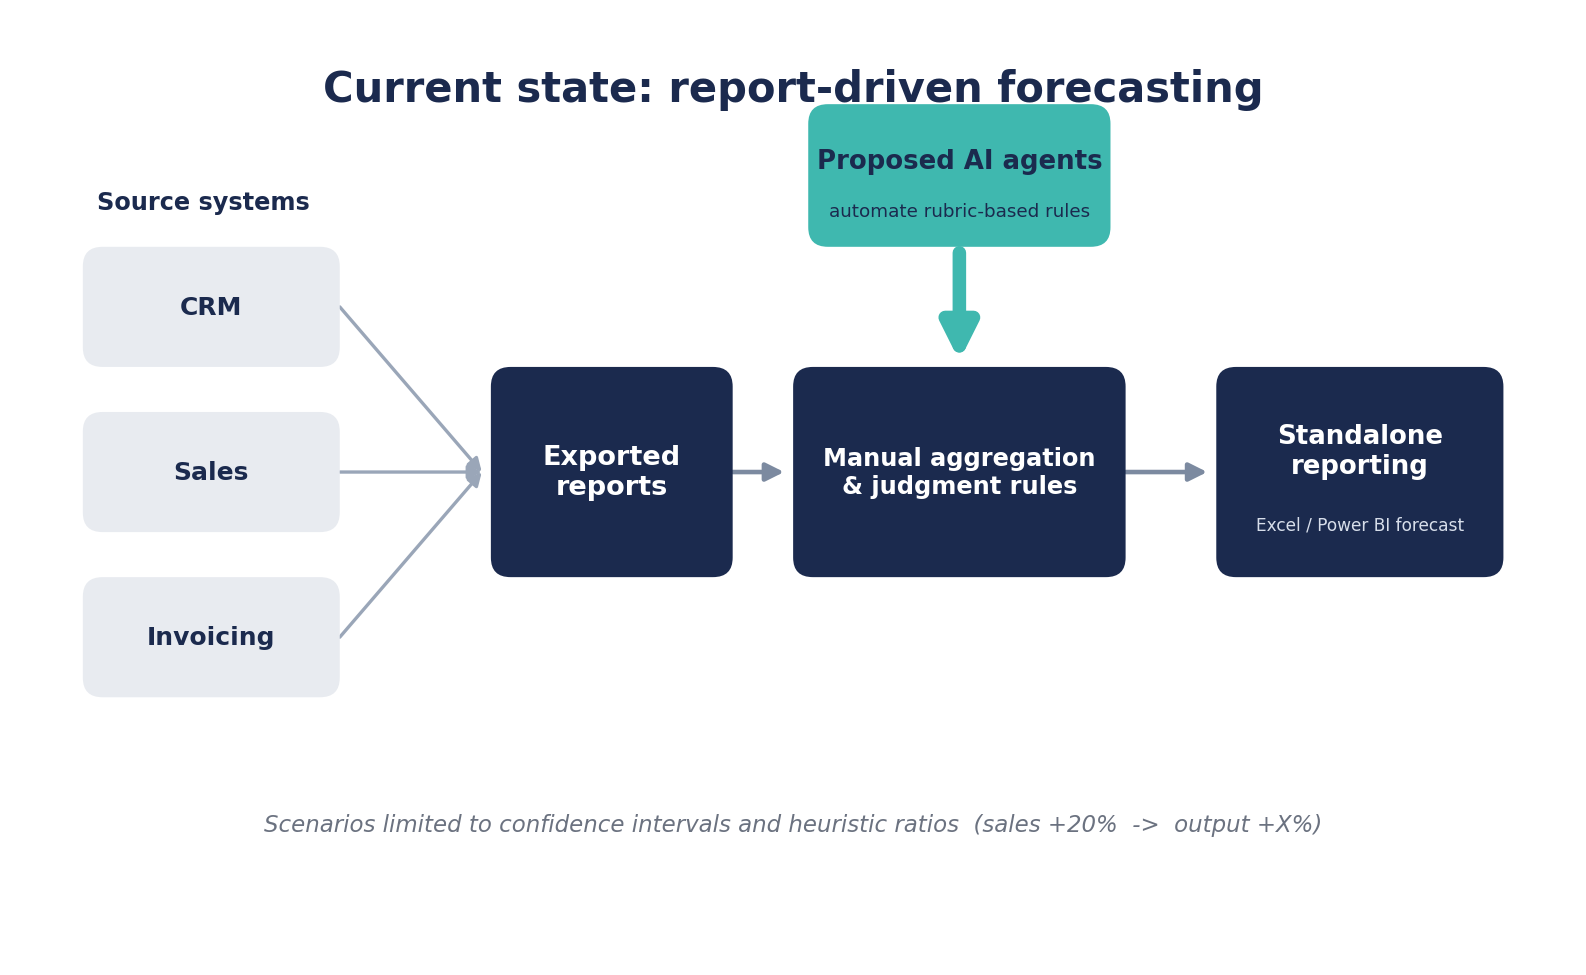
I was recently working with a client on long-term financial planning. They were looking to implement agentic solutions to streamline their existing forecasting process, which involved organizing data from various reports and systems, making judgment calls based on outcomes and logic rules, and applying disparate rules in their aggregations. This is a common scenario I encounter. A strong use case for agentic AI is identified, and the recommended course involves first improving data pipelines and addressing pain points systemically.
That recommendation leads to an elevated conversation. What is actually possible, what do ideal systems and platforms look like, and how can we extend existing reporting and BI ecosystems into a robust platform that serves as wide a range of functions and stakeholders as possible? The work they wanted agents to perform was mostly rubric-based, things like treating a deal over $1M differently from a smaller one in how it is forecast. Agents are well suited to these rules, but analytics can let performance determine and improve the rules.
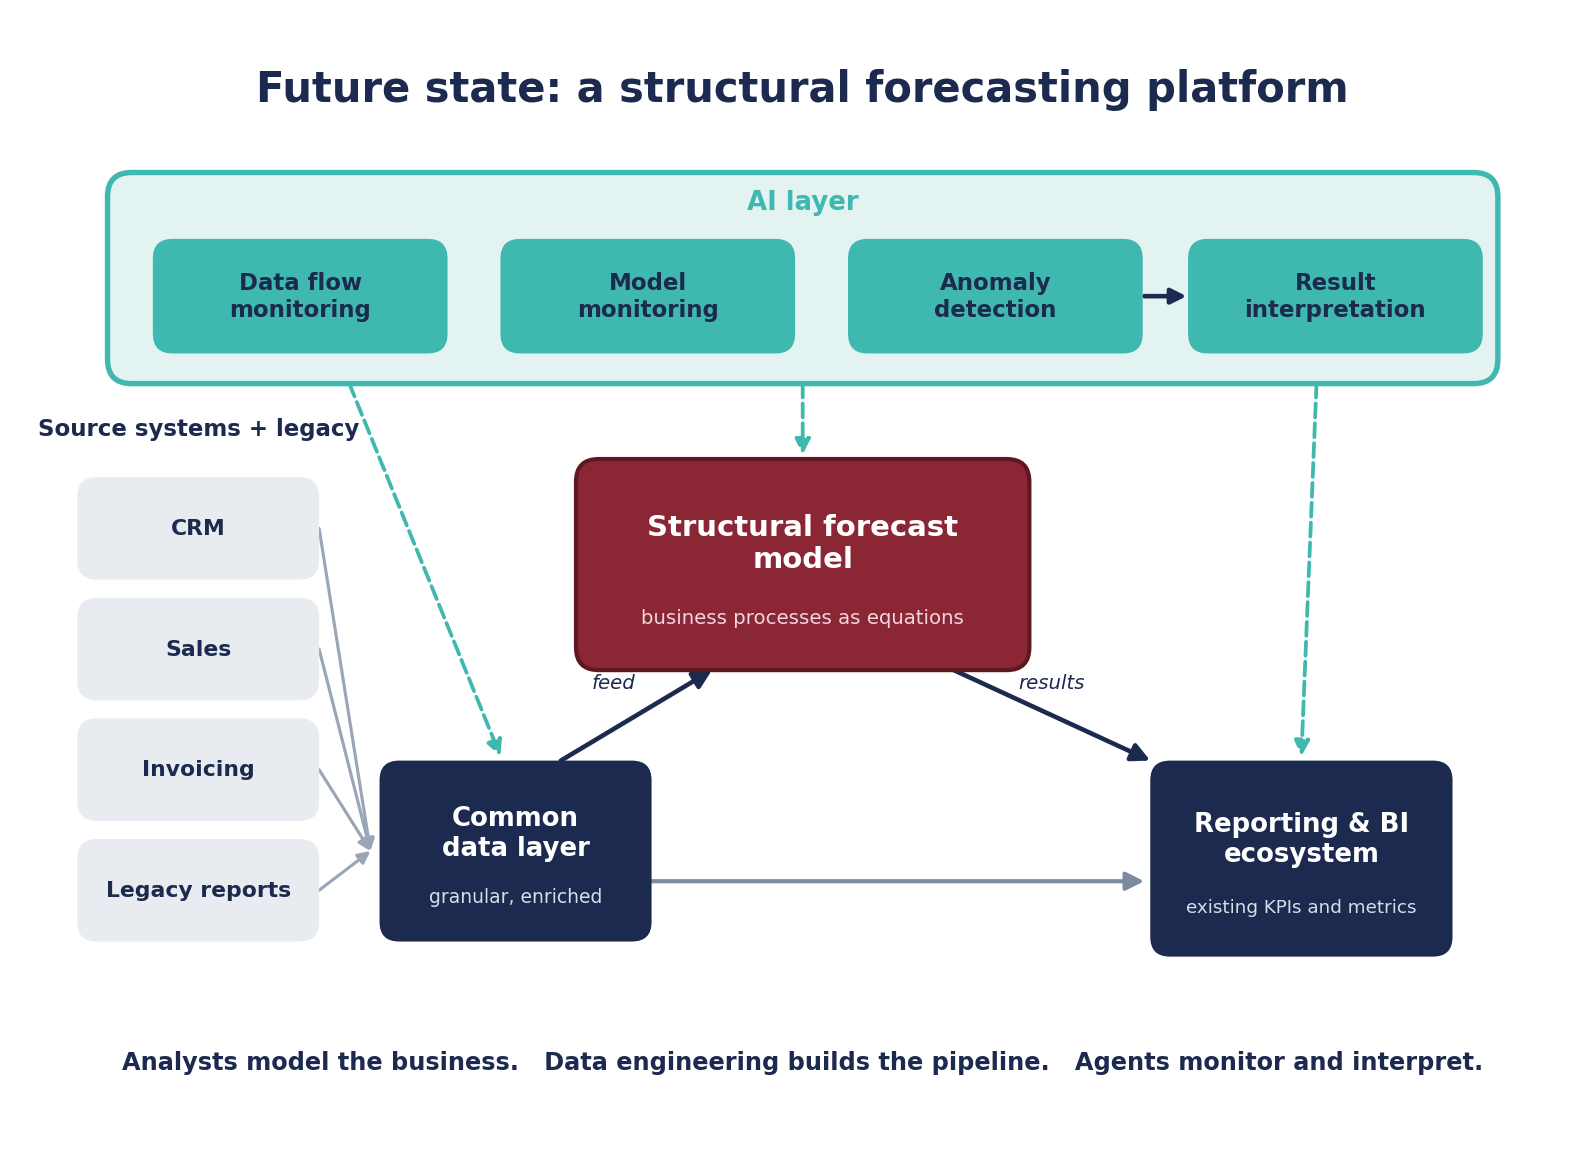
Pointing an agent at the manual work of an analyst solves the wrong problem. The higher-value move is to put each capability where it pays off, with data engineering building the pipeline, the analyst modeling the business, and AI monitoring and interpreting rather than performing the analytical work.
Figure 1 shows where they wanted to point the agents. The rest of this piece is about where each capability actually pays off.
The “what-will-happen-if …” question
One of the most common questions posed to an analytics function is “what will happen if …” When leaders are on the cusp of a strategic or directional decision, they want to understand the impact before they make the leap. If a leader’s mandate is tied to executing a growth strategy, they want to know what outcomes they can expect a month, six months, a year, or more out.
There is a fundamental analytics choice here. If the question is “what will happen if …,” the cognitive path of least resistance is to estimate a ratio from observed prior changes. This gives a number. It is easy to digest. It was derived from data. It is comforting. It begs for no framework or supporting structure. If you increase your workforce by X percent, you can expect output to increase by Y percent: back of the napkin, simple. If the results support intuition and meet the business objective, the project moves forward, no questions asked.
But was that actually data-driven decision making? I would posit no. It was a decision made from a single data point, dubiously estimating a marginal impact without any rigor or substance to describe the nature of the enterprise. The economic and market conditions right now may be dissimilar to the period used to make the calculation, and the back-of-the-napkin estimate may or may not hold.
Sales organizations illustrate this well. Sales pipelines are often treated as a linear funnel. They are well understood, and a business has a good idea of how their pipeline will translate into revenue. Experienced people know that when a deal goes into the CRM, maybe half of the expected revenue will actually materialize when it signs. I have seen these types of heuristics hold with remarkable accuracy. But will it hold true of every deal? A renewal of a long-term relationship is probably closer to its booked value than a brand new deal with an unknown client where the details aren’t ironed out yet. We can model that. We can allow for interactions by group type, and treat different deals, sellers, or workers differently, letting them move at different rates.
Specification over prediction
What I see in the world of data science is a primary focus on methods and tools that produce the most accurate results, especially within sample. That is a fine goal for most predictive models, and many of the methods inside data science were built from an engineering background, designed to better predict the next thing.
What I want to advocate for is structure. In business there are processes that generate the data, and those processes are real. A manufacturing line moves inputs from step A to step B to step C, value added at each step, with defined and largely predictable relationships. Interrupt one step and the next is affected in a known way. The data we work with is generated by those same processes. If we design our forecasts around the underlying data-generating process, capturing it with mathematical constraint rather than throwing a wide breadth of data at techniques that discover unknown relationships, our models behave in ways that reflect what actually happens in the real world.
Even if a structural model is not the highest performing on perfect prediction, it remains superior if it adequately and appropriately describes the relationships in play. A natural consequence is that you are directly estimating the marginal effects changes to controllable inputs have on outputs. That lends itself extremely well to business planning, scenario planning, and long-term financial forecasts.
This is about framing and use case, not dogma. Anytime the structures and processes are known, I prefer to model them with direct structural and mathematical constraints, even if a machine learning algorithm outperforms within sample. The structure provides a better behaved model that lends directly to understanding business processes and systems. Prediction-first machine learning earns its place when you have data constraints, like small samples that would eat the degrees of freedom a structural system needs, or missing data in the middle of a process where the relationship is known but cannot be estimated. If the aim is to react minute-to-minute in a chaotic environment, say short-term price changes in a market where the purpose is to make directional trades, those models perform well. If you have a process refined from experience over years, an assembly line or a distribution network, and you want to change strategy and understand how it affects everything else, a framework that describes it with precision using internal business metrics is preferable.
Build from the bottom up
I started my career performing hyperlocal, regional, and national economic forecasts across industry, land use, and demographic sectors, working across methods from grouping and allocation to structured equations to machine learning. The most important thing I observed is that you get the most flexibility and overall utility when the framework is built from the bottom up, starting with human interactions in the real world.
If historic outcomes are measured at granular levels, at the actual transactions between agents, we can forecast forward agent by agent and unit by unit, then aggregate up rather than impose relationships from the top down. There are differences in the agents themselves. Different salespeople perform differently, and different producers have varying quality, tasks, and output. Granular data lets us capture that variability at the individual, group, and organizational levels.
This is not an unqualified claim about accuracy. The model will not predict what an individual will do with the same accuracy as the aggregated total. The point is flexibility and usefulness. Model below the level you intend to display, then roll up to meaningful segments, and you get results that serve a wider audience and let stakeholders dig in and answer deeper questions from the same model. As you aggregate, idiosyncratic variability within a group tends to factor out, and the commonalities across the group can be isolated and carried in the forecast itself. Where a granular unit is thin, the same structural understanding enters as a constraint or a prior, and estimates remain stable.
Granularity is also what makes the model strategically useful. Structural forecasting on granular data gives flexibility in how you segment an organization and its activities. It supports real conversations about potential changes in client segmentation, market distribution, delivery channels, sales resources, and customer satisfaction. It stratifies segments that are over- and under-performing so leaders can make decisions about capital investment and direction.
Where the structure comes from
The reasoning behind a structural forecast doesn’t live in the analytics team. It isn’t something an analyst or a data scientist holds natively. The real understanding of the business process lives with the experts, the people living it day to day, the sellers, the frontline workers, and the delivery operations. I have found it immensely helpful to send analysts and data scientists into the field to see how the systems are used and understand why the data looks the way it looks, rather than make assumptions from reported data alone.
The human intelligence inside business units is every bit as valuable as the data assets themselves, often more so. Unlocking insight is a collaborative effort between business stakeholders, the analytics team, and frontline workers. That collaboration is where the forecast model’s structure is established. How does a lead become a sale? How does a contract become orders, and how do orders become deliverables? Are there hard constraints: outcomes that could never occur mathematically within the data? These constraints are encoded explicitly, not relationships to leave an algorithm to approximate.
A demonstration on public data
To make this concrete, I built a demonstration tool on public data, the Olist Marketplace Scenario Planner, available under the tools section of this site. I chose the Olist Brazilian e-commerce dataset deliberately, because it is published on Kaggle and allows for exactly this kind of structural estimation in a changing market.
Over the period of their public data, Olist was in a seller growth phase, attracting sellers through marketing channels like paid search and social media, and offering shipping subsidies to get the marketplace off the ground. Those are levers. Increase social media spend and you draw in new sellers. Pay more for search and you draw in more. Sellers come and go, like client churn. The active seller base affects the products sold, and sales flow through to revenue. Each structured relationship leads into the next. A system of equations governs the process and can be estimated. Individual lever effects are parameterized and isolated to simulate forecasted changes. The model treats agents as price takers, so price is handled internally rather than offered as a lever.
One specification decision shows the difference from a prediction-first approach. When I profiled the data, paid search and social were the two channels meaningfully connected to new-seller acquisition. Other channels were present, and when estimated directly, some showed negative effects on seller counts, which is a data artifact, not a real relationship. I kept all channels in the model but collapsed and estimated the smaller ones jointly. Thereby small-sample noise does not produce a nonsense result where advertising reduces sellers. A predictive model might faithfully reproduce that artifact. A structural model lets us interject and ask whether the relationship makes sense given what we know about the process.
The model’s most striking output is structural. At the spend levels in the data, the seller base isn’t sustainable. Estimated monthly exit averages 33 percent across categories, so roughly 400 of about 1,260 active sellers churn each month while baseline inflow replaces only about 130. Without more marketing, the seller stock declines toward a new equilibrium around 500 to 600 within a year.
The tool itself is exploratory. It exposes sliders on a dashboard. Stakeholders can say “double social spend” or “cut the freight subsidy in half” and see the modeled outcomes respond at each step in the chain. That is how you build confidence, through transparency about what the model captures, not by selling a marginal effect as an outcome. The best analytics products are invisible. The equations stay behind the curtain, and what the stakeholder experiences is an interface that responds to their decisions in ways that match how the business works.
The strategy deck distills the tool into a decision artifact: three preconfigured scenarios with strategic framing, a comparative scorecard, and a recommendation. Defensive consolidation holds marketing flat and shows the trajectory under no growth investment. Capital-efficient growth leans into the highest-return channel and holds subsidies flat. Aggressive scaling pushes every channel hard with a subsidy, which is roughly what Olist actually did. My recommendation outlined is deliberately contrarian. All three paths show the seller base resetting, so the call isn’t to spend more, it is to take the most capital-efficient path through a structural reset and to show the math.
What Olist actually did (after the end of the Kaggle dataset) is telling and consistent with the model’s core prediction. They raised $46M from SoftBank in 2019, $80M led by Goldman Sachs in early 2021, and $186M later that year at a $1.5 billion valuation [1, 2]. They poured capital into the growth engine and expanded the business, and even with that capital they later cut staff, citing the need to grow efficiently [3]. The treadmill economics the model identified appear to have shaped the company’s actual trajectory.
From a number to a platform
The advantage of planning with a structural forecast is that it isn’t a single number. It forecasts forward and shows what you can expect at every horizon. You might make an investment and not see a return for six months or a year. The model shows how that change propagates through the system at each time period. It is tailored to your data environment, it understands how your business, your systems react to these changes, and it is truly data-driven.
This is where the platform pays off. Building on a full data ecosystem produces large efficiency gains. Analysts no longer source data by hand from disparate systems, pulls are scheduled, and as the pipeline changes the results trickle all the way through. Models are re-estimated regularly so they stay robust to a changing business environment, and when a practice shifts the performance of a client or a business unit, the model reads the change in momentum and forecasts accordingly. Stakeholders find it intuitive because it extends the reporting suite they already use. This is not a call to reinvent the wheel. Build the forecast on what your enterprise already measures, what they care about. The hard work is done. Build the forecast on top of what you have, extend it into a platform that opens new frontiers in how you use the data you already have. You already know what measures and KPIs are most important, you already have a good understanding of how data moves and your organizational objectives are achieved. Use it.
Where each capability earns its place
Engaging data engineering to preempt the manual work frees the analyst to use their expertise to establish and model the business processes, then shift focus to scenarios and results. AI agents fill gaps in data engineering and MLOps and are utilized in identifying patterns in outcomes and interpreting them, monitoring models and data flows, and calling out deviations. Analytics work remains with the analyst and AI is the tool that gives them what they need. Put available tools where they have the highest return.
A culture that uses the forecast
None of this works if an organization treats data as a validation mechanism rather than a decision-making platform. Where the culture uses data only to validate decisions already made, there is resistance to any forecast that doesn’t show growth. It takes a mindset shift to see that a forecast showing contraction is valuable precisely because it shows you now, while you still have the understanding and the opportunity to act. Done well, and delivered as a complete platform, this approach simplifies the understanding of organizational direction with transparency around the why and the what. It doesn’t look back to validate the past. It drives future-focused, truly data-driven decisions.
If forecasting is something you are interested in for your organization, reach out. I would love to talk about it.
References
[1] Alcantara, A. “Goldman Sachs Leads $23M in Funding for Brazilian E-Commerce Startup Olist.” TechCrunch, 15 Apr. 2021. techcrunch.com
[2] Dias, T. “Brazil’s Olist Gets Its Horn with New $186M Funding Round.” TechCrunch, 15 Dec. 2021. techcrunch.com
[3] “From Europe to LatAm, Startups Lay Off Staff amid Belt-Tightening.” Bloomberg Linea, 2022. bloomberglinea.com
[4] Olist. “Brazilian E-Commerce Public Dataset by Olist.” Kaggle, 2018. kaggle.com